
Management system
METRO’s strategic focus on creating added value for our customers and the objective of sustainably increasing the value of our company are also reflected in our internal management system. We use the key figures described in the following for planning, management and control of our business activities. Selected key figures used in our management system (like-for-like sales growth, EBITDA and return on capital employed) form the basis of the Management Board’s variable remuneration.
The focus of the group’s operational management is on those value drivers that have a direct effect on the medium- and long-term corporate objectives and are directly related to our strategy.
Management system
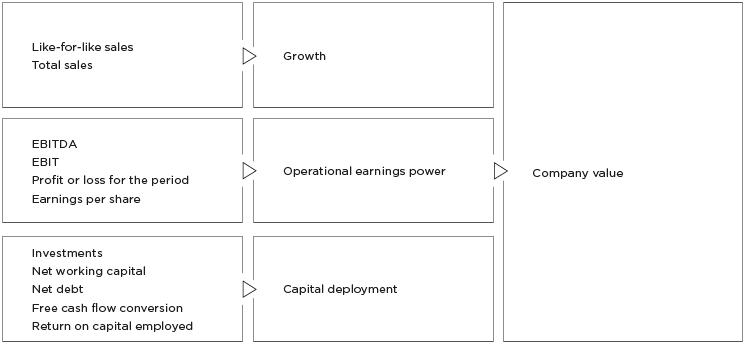
The most important key performance indicators for METRO are exchange rate-adjusted sales growth (as a total figure and a like-for-like figure) and EBITDA excluding earnings contributions from real estate transactions. Our management system also makes use of other significant performance indicators, which are explained in the following as well.
Key performance indicators describing the earnings position
The first of our most important key performance indicator for our operational business is the exchange rate-adjusted sales growth (respectively as a total figure and a like-for-like figure). The like-for-like sales growth represents the sales growth measured in local currency generated in a comparable area, or in relation to a comparable panel of locations or merchandising concepts, such as online shopping and delivery. This figure only includes sales of locations with a comparable history of at least 1 year. It follows that revenues generated by locations that were opened, closed or affected by significant remodelling works or other conceptual changes in the reporting year or the comparison year are excluded from consideration.
The second of our most important key performance indicator in addition to sales growth was introduced in financial year 2017/18 and is EBITDA excluding earnings contributions from real estate transactions. This key performance indicator transparently reflects METRO’s operational performance. The development of real estate assets and the realisation of divestment income will continue to be a central component of the group’s real estate strategy.
Other important key performance indicators of METRO are profit or loss for the period and earnings per share. These key performance indicators ensure that the tax result and the net financial result are taken into account in addition to the operational result and thereby allow for a holistic assessment of METRO’s earnings position from the perspective of the shareholders.
- For more information about these performance metrics, see chapter 3 economic report −3.2 asset, financial and earnings position – earnings position.
Key performance indicators relating to the financial and asset position
The management of METRO’s financial and asset position aims at sustainably assuring liquidity and arranging cost-effective sources for the financing requirements of our subsidiaries.
- For more information about the financial and asset position, see chapter 3 economic report −3.2 asset, financial and earnings position – financial and asset position.
The key performance indicators used in this area also include investments, which are planned, reported and audited both in aggregate for the group as well as separately for the sales lines. Investments are defined as additions to non-current assets (excluding financial instruments and deferred tax assets).
Another focal point in the area of the financial and asset position are regular analyses of the net working capital, which are carried out for the purpose of managing the operational business and capital deployment. Developments in net working capital over time result from changes in inventories, trade receivables and trade liabilities. Receivables due from suppliers are recognised in the items other financial and non-financial assets.
The net debt and the cash flow before financing activities are also used as key indicators in the management of METRO’s liquidity and capital structure. The net debt results from the balance of financial liabilities (including finance leases), cash or cash equivalents and short-term financial investments.
METRO also analyses the free cash flow conversion to measure the group’s success in transforming the generated income into cash inflows. The free cash flow conversion is the ratio of the simplified free cash flow and reported EBITDA. The free cash flow for the purpose of determining the free cash flow conversion is defined as the reported EBITDA less investments (without finance leases renewals and mergers and acquisitions) +/− change in net working capital.
Value-oriented key figures
The assessment of the operational business continues to rely on the key figure return on capital employed (RoCE). This key figure measures the yield on the capital employed (RoCE = EBIT / average capital employed) in a certain period and also allows for an assessment of the performance of the group’s individual segments.
The resulting RoCE is then benchmarked against the respective segment-specific cost of capital before taxes, which represents a minimum yield on the employed capital at market rates and is based on capital market models.
METRO also frequently uses value-oriented key figures to assess both prospective and past investments. These include the discounted cash flow method, economic value added (EVA) and other liquidity-oriented key figures such as the amortisation period for investment decisions.